The objective of user experience design is to create products and services that users will feel good about using. But how do we know what users want? How can we empathise with them or understand their goals and objectives while also knowing which problems they want our products to solve? That’s where user research comes in.
User research is the process of researching your product’s current or potential users. User research helps UX designers to understand their users so that the products they create are more likely to satisfy them while meeting business objectives.
However, there are all kinds of studies that can be conducted to get to know your users, from very simple to very complex. There are also different research methods that can be used. Knowing how, when and why to conduct user research can vary based on a number of factors, including time and budget, and it’s valuable to be able to judge when and what kind of user research is most important.
In this post, we’ll discuss the ins and outs of user research by reviewing the following:
- When to conduct user research
- Qualitative vs. quantitative user research methods
- Recruiting participants
- Analysing data
- Synthesising and sharing user research
When to conduct user research
User research isn’t something that should be done once and forgotten about. You should conduct user research throughout the design process, with your methods varying based on the questions you need answered at different stages of the design process.
For example, in the discovery phase, your goal should be to conduct user research that helps you get to know, understand and empathise with your users and their needs. At this stage you haven’t designed anything, so you should investigate users’ preferences, attitudes and priorities.
In the design phase, your goal should be to conduct user research that sheds light on whether your solutions work as well as you hope. At this stage you’re looking to validate the usability of your designs and to understand what parts of the experience might confuse users.
User research can also be conducted after a product launch, usually by monitoring metrics like user analytics and complaints. These things can point to how well the product continues to meet users’ needs and may also point to the parts of a product that require redesigning.
Take a look at some of the best UX research tools on the market right now to help you with these different methods.
Qualitative vs. quantitative user research methods
User research can employ either qualitative or quantitative methods. The choice of which one you use – or whether you decide to use both – will depend on what research question you want to answer.
Qualitative research involves learning about users’ opinions, thoughts and feelings about a given topic. Usually the data collected comes in the form of words and text and helps answer questions about why users do things, how they do them or what their specific preferences are.
Qualitative research methods include ethnographic studies, where you observe people in the context of their own space, one-on-one interviews, surveys using open-ended questions or focus groups. This method can be very time consuming; for example, ethnographic studies can last several days. In contrast, a focus group can be conducted in an afternoon.
Either way, it’s almost always necessary to have at least one in-person facilitator available to moderate qualitative research. However, only a few research participants are needed to uncover meaningful results. Qualitative research tends to be most useful in the discovery phase of the design process.
Quantitative research produces measurable data in the form of numbers. It’s more concrete than qualitative research and answers questions about what people do, such as how often they use a product, how much time they spend with the product or how many pages of a product they view.
Quantitative research methods include surveys that ask multiple choice or yes/no questions, first-click tests, A/B tests and eye tracking. These methods can be fairly simple to implement because they can often be automated with participants following prompts on a computer screen, therefore it’s not always necessary to moderate the studies.
On the other hand, in order to get enough data to reach statistically meaningful conclusions, it’s necessary to include more participants. Quantitative research is often most useful in the design phase when it can quickly uncover if certain UX solutions are working as intended.
Qualitative and quantitative research have different strengths and weaknesses, and consequently can complement each other. Studies that employ both qualitative and quantitative research methods are called mixed methods research. This kind of research enables you to gather measurable data while also gaining insight into why people make certain choices.
Recruiting participants
Recruiting the right participants is essential to user research. However, the process of finding participants and getting them to agree to take part in your study can be challenging. There are several methods you can utilise but they all start with the same basic requirement.
Before you can recruit participants, you must decide on the characteristics of the people you want to include in your study. This should be based on the kinds of users your product is targeted towards. You’ll then create a screening survey, called a screener, that will enable you to gather information about potential participants so you can identify those who best represent the users for your product and weed out those who don’t.
To create a screener and recruit participants take the following steps:
- First define the demographic and other important characteristics of the participants you want to recruit. For example, if you’re creating a tool to monitor heart health in men, your participants will be very different than if you’re building an app for recent high school and college grads to connect with potential roommates. However, make sure you don’t get overly restrictive in your criteria, as it may cause you to exclude more participants than necessary.
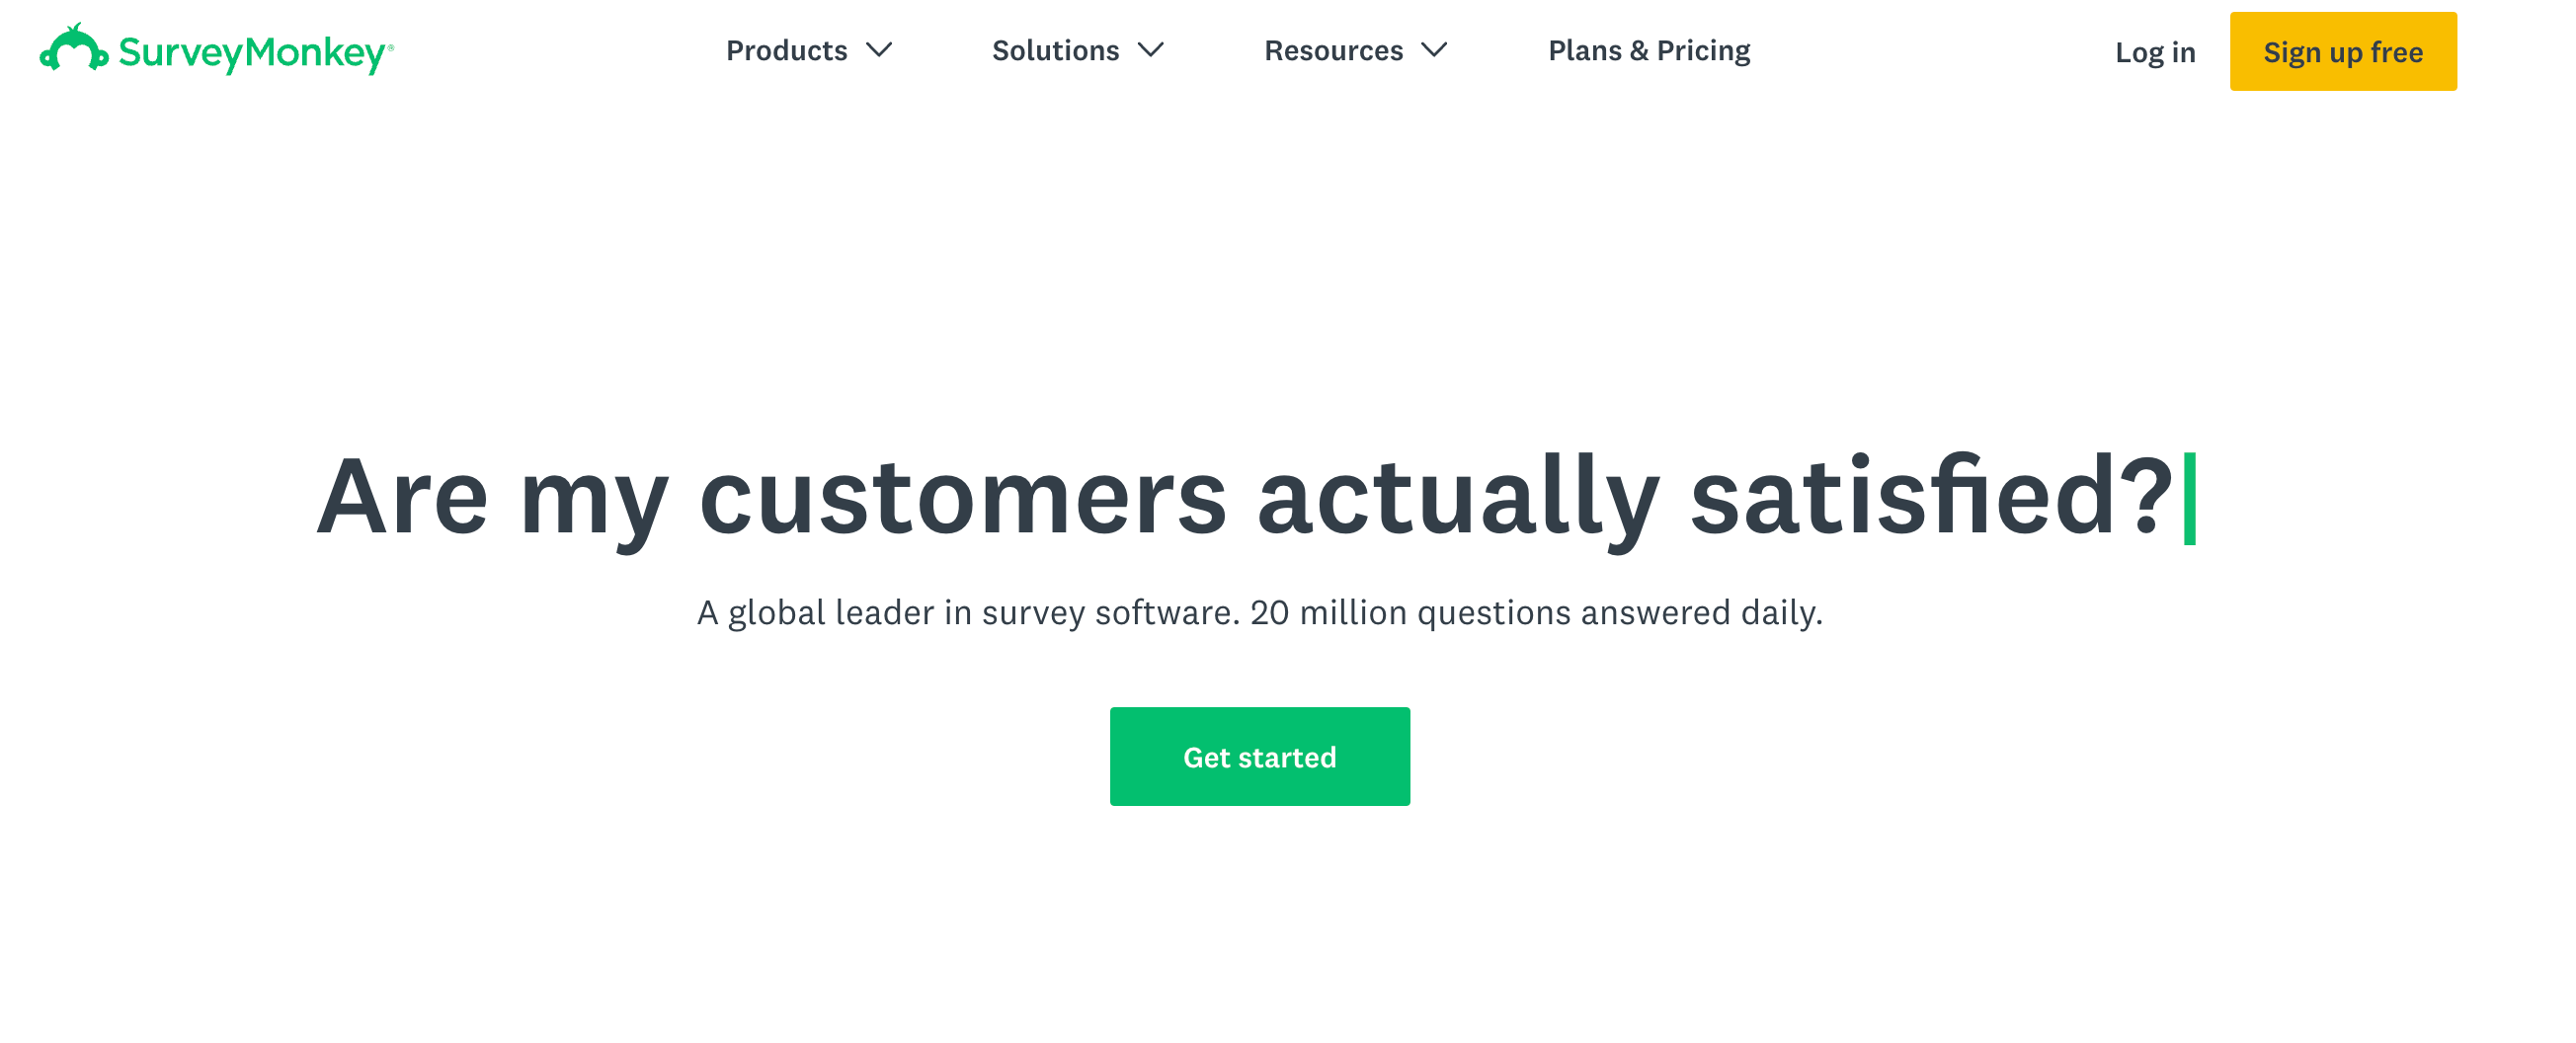
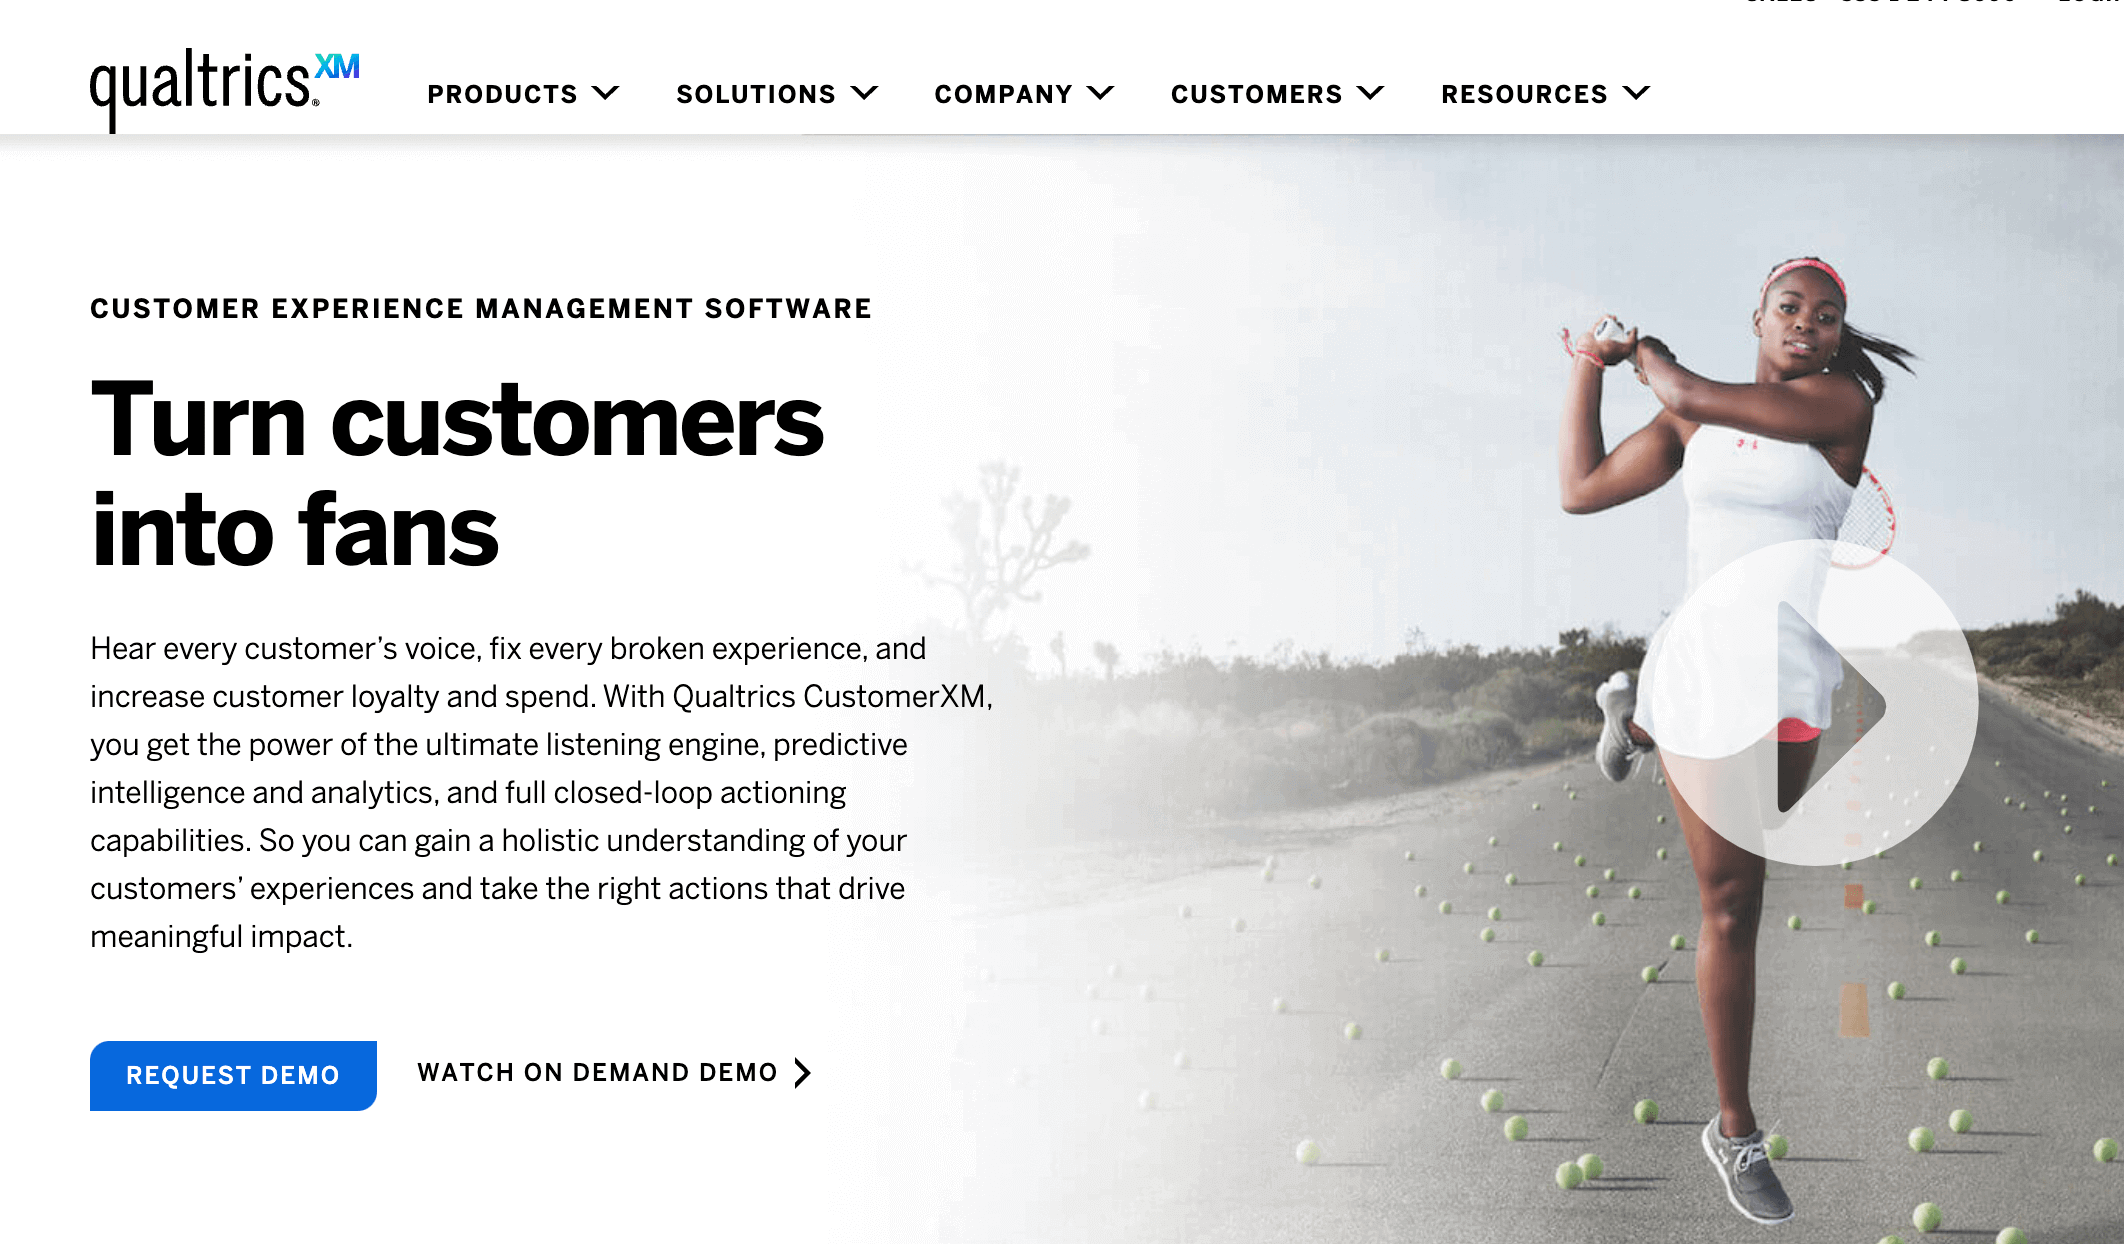
- Next, you’ll construct your screener by creating a series of questions that help you decide if each potential participant is a fit for the study. You can use a survey tool such as SurveyMonkey or Qualtrics to construct the screener, so it can automatically screen candidates based on their answers to your questions.
- Finally, you must decide on a recruitment strategy. There are several ways to do this but they each have pros and cons. You can hire a professional recruiting agency that will find and vet participants for you. While this is the least time-consuming recruiting option, it’s also the most expensive.On the other end of the spectrum, you can recruit people through your social media channels, through online forums related to the product you’re designing or even turn to colleagues and fellow employees. This is more cost-effective but it will take more time. However, the biggest potential drawback is that participants’ responses may be biassed. Because they are likely to know you and possibly even be familiar with the product you’re working on, it may prevent them from providing the most honest answers in your study.
The recruitment strategy you choose will also depend on the kind of study you’re conducting as the number of participants you need can vary widely. Nielsen Norman Group suggests recruiting only five people for a qualitative usability study. For quantitative studies, you’ll need at least 20 participants to ensure your results are statistically significant but a number closer to 35 is ideal.
Analysing data
Once you’ve conducted your study, you’ll be left with a great deal of data. In order to make that data useful you’ll have to draw meaningful conclusions from it. This starts with analysing the data. If you’ve conducted a qualitative study, your analysis will also be qualitative and if you’ve conducted a quantitative study, your analysis will be quantitative.
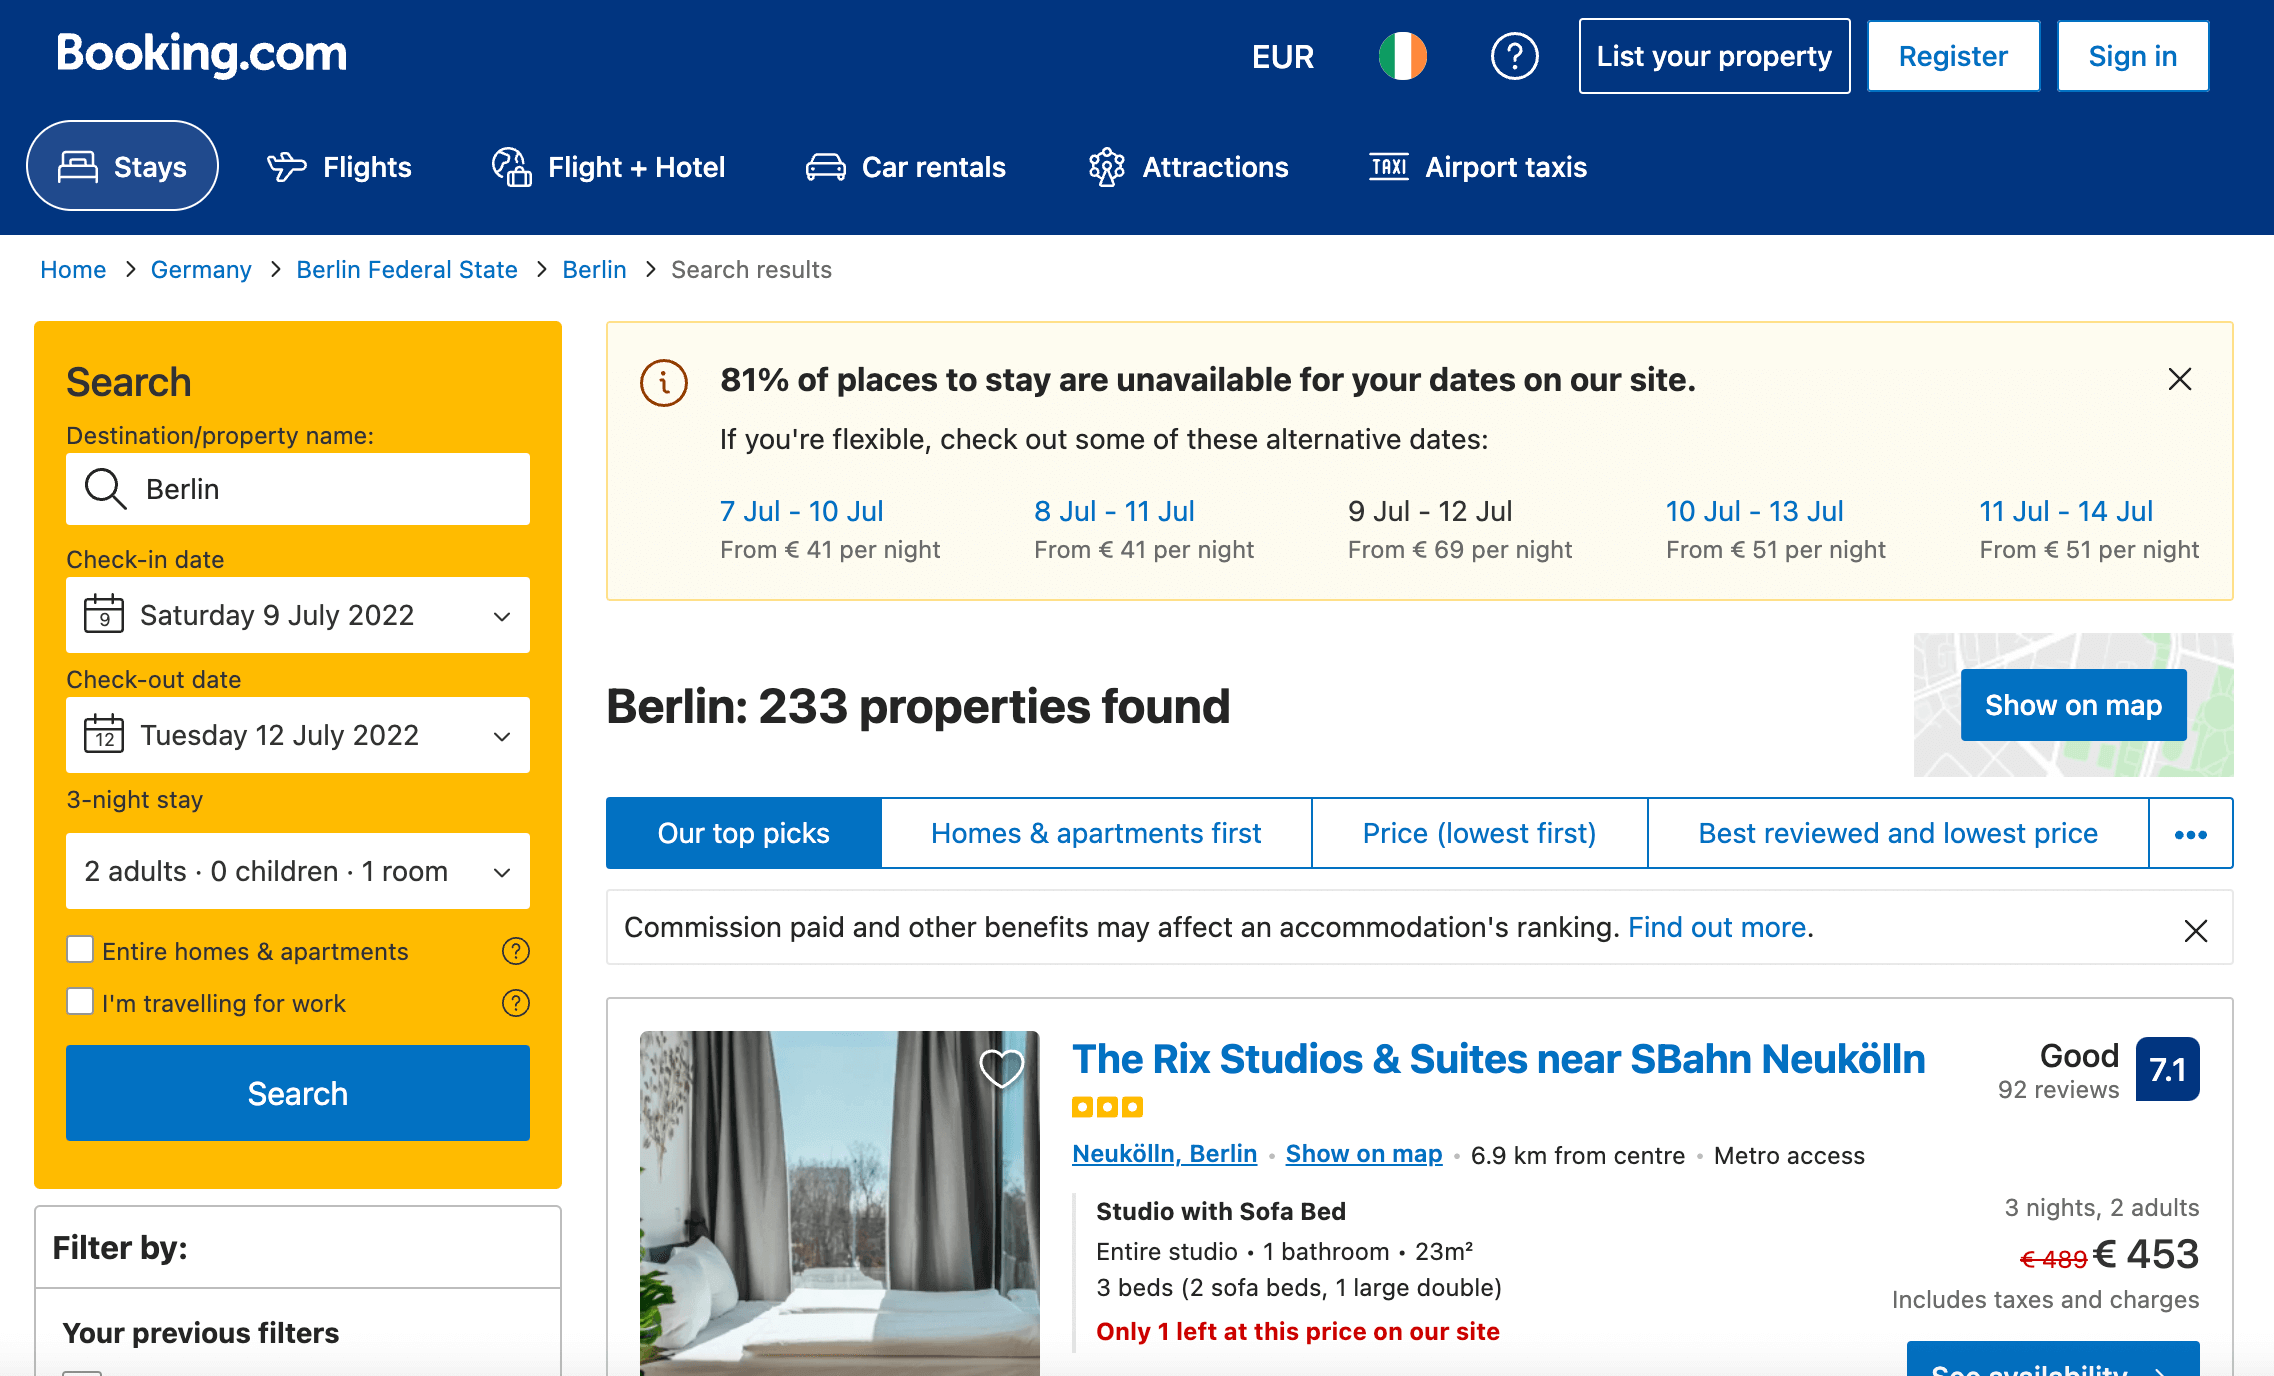
Quantitative analysis requires statistical evaluation of your data. You will have to organise the numerical data you’ve collected into a dataset, usually on a spreadsheet where the rows represent the answers of each participant and the columns represent each question they’ve answered. Then, using statistical software like SPSS or formulas on a Google or Excel spreadsheet, you’ll analyse each of the variables you’ve collected information about. For example, if you’re researching how well a new tool for finding and booking hotel rooms works, you might analyse your data to see how long it took participants to find a hotel they liked, what parts of the tool the participants used the most and whether and when users abandoned the booking experience.
Qualitative analysis is more subjective and time consuming than quantitative analysis but can lead to even greater insights. Once again the first step is to organise your data. Although qualitative data will primarily be in the form of words – either based on your research notes, transcripts of interviews or written answers to open-ended questions – you’ll likely want to use a spreadsheet where each row includes the data gathered from one participant.
You’ll then review the data looking for patterns and recurring themes. One of the best ways to do this is to develop codes for each theme you find. A code is essentially a descriptive label that you can assign to each chunk of text that brings up the described topic.
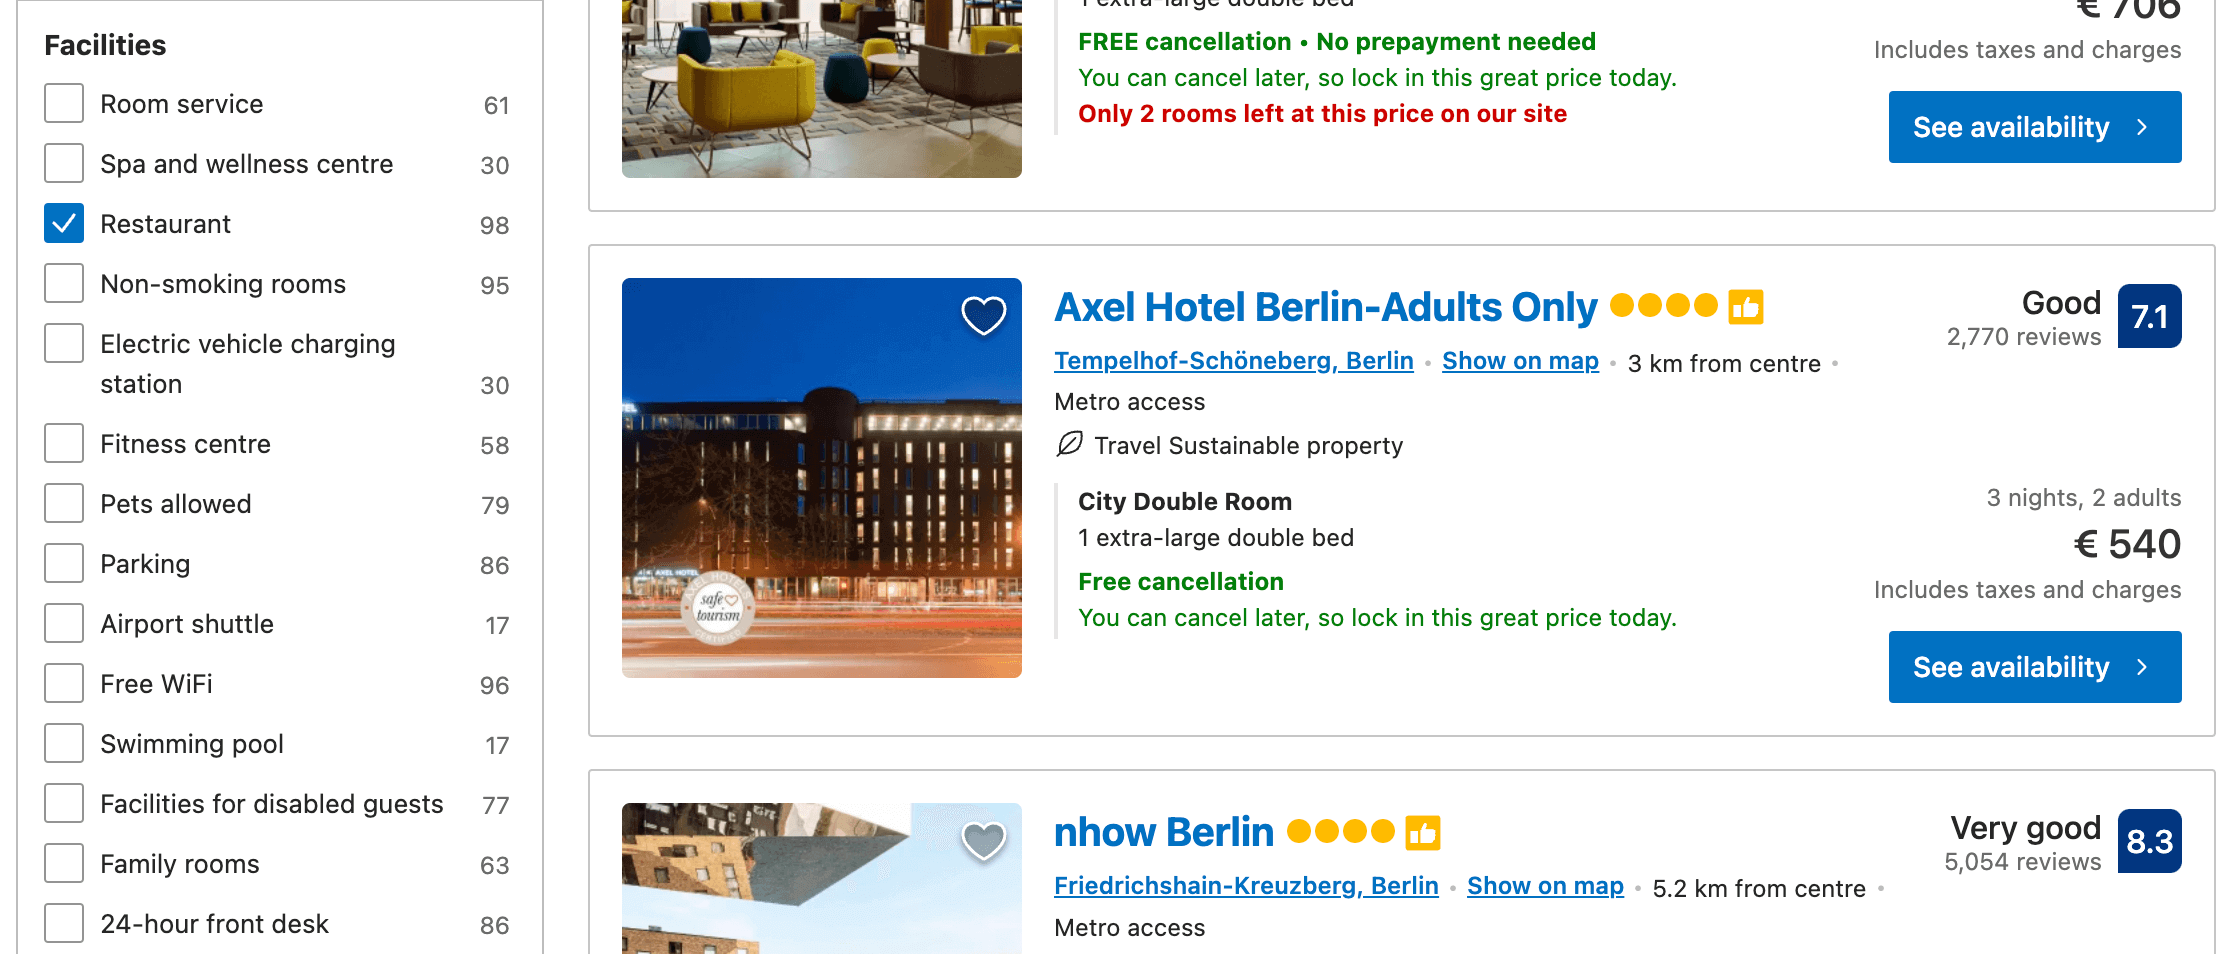
For instance, to go back to the hotel booking tool, if one of the patterns you notice is participants continually mentioning a desire to know whether the hotels they can book have on-site restaurants, you can use the code “restaurant” to label the text everywhere this issue appears. You can do this manually or with a qualitative analysis tool such as NVivo or Dedoose.
Once you’ve coded your data, group your codes into larger categories called themes, which will provide insights into the data. For example, if you have codes like “restaurant,” “see menus” and “complimentary breakfast,” they can all go under a theme labelled “on-site food access”.
Synthesising and sharing user research
After you’ve analysed your data, you need to synthesise it so you can communicate your key findings and insights to make recommendations to stakeholders and clients. Remember, this should trace back to your research goals, the reason you conducted user research to begin with. Any insights that meet those goals should be prioritised in any compilation of your research findings.
For example, if one of your research goals was to learn what features people prioritise most when looking for a hotel, share those findings first. Then share the insights that resulted from those findings and make recommendations about how those insights should influence the design of the hotel booking tool you’re creating.
Meghan Wenzel recommends using a framework where each research finding is followed by three bullet points:
- one for the insight the finding leads to
- one for your recommendation based on the insight
- and one for an action that can be filled in later by the design team when it determines how best to fulfil the recommendation
For example, if your finding is that your participants expressed a desire to find hotels with on-site restaurants, your insight would be that people need to be able to quickly determine which hotels in the city where they are travelling have restaurants. Your recommendation could then be to ensure information about on-site restaurants is salient and easily accessible for each hotel. This can then be followed by more details into the finding, including quotes, examples and further information from your research.
This should all be formatted so that it can be shared and easily understood by your stakeholders and clients. Regardless of whether you explain the information in a live presentation or send it to stakeholders as a document to read on their own time. However, make sure you prioritise the voices of your research participants so stakeholders can develop empathy for them.
Sharing your findings should also be the jumping off point for discussing the design solutions you’ll implement in your user experience. Make full use of these discussions, ensuring that the insights and recommendations that come out of user research are put to work.



![The 10 best prototyping tools for UI/UX designers [2025 Update] 8 UI UX prototyping tools header image](https://www.uxdesigninstitute.com/blog/wp-content/uploads/2025/01/93_UX_Prototyping-tools_Illustration_blog-1.png)